


Today I think it is appropriate to talk about the Drawdowns. There is so much to talk about this matter! I’m going to barely scratch the surface. At most!
I feel like it, specially because right now we (=EPG) are in a drawdown; We are hoping for any trade we take to reverse this trend and again; the StopLoss cripple our hopes. Wait a minute: That could be an interpretation of a drawdown…
Is EPG in a drawdown?
Well, a picture is worth a thousand words:
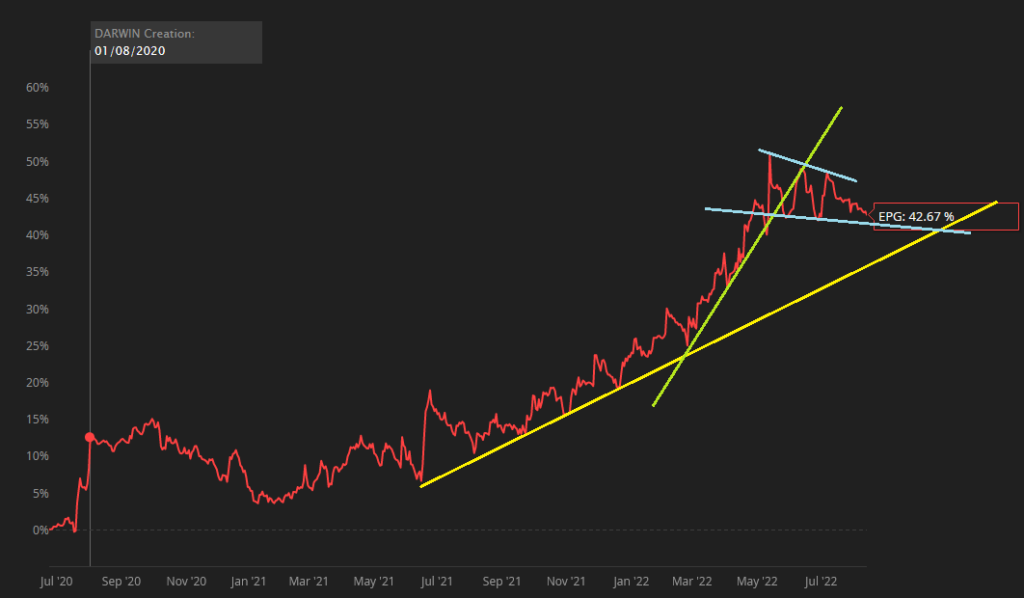
I have drawn some trend lines. Though I’m not a chartist we could say that we broke the short-term high tendency (green line), but we still are on the longest trend tendency which is the yellow line. However, we are making a down trending channel which are the blue lines.
When will the pain end?
Maybe we could predict that in one or two months the downtrend channel (blue lines) should intersect with the yellow line which is the longest uptrend and that should be the bottom of our drawdown. Maybe! After all, at the end of the day you can draw hundreds of alternative lines to predict whatever you want. I’m not a big fan of chartists, you can tell 😊. But it’s always nice to draw colored lines, I give you that.
Just the numbers please
I do not trust anything but numbers. I’m a numbers guy! They never lie. So, let’s focus on our drawdown subject, and crunch some numbers:
Throughout its history EPG has had a maximum drawdown of 9,95%, while right today the drawdown is 6,05%. So, 6,05% is the drawdown from EPG All Time High (ATH) from mid-May 2022. That’s equivalent to the 60% of our max Drawdown.
If we take as a reference point our Max DD, we still could fall about an extra 2,5% which would push our returns to 40%, give or take.
There is more, because on the other side, looking at our EPG trending lines in our chart above we would predict the bottom at 40% too aprox.
Wow. That’s just amazing!! Everything fits. In this case, if we would credit our charts: Wild gess would be that we will hit the bottom at 40% return in 2 months aprox., that could be October.

The magic of Darwinex
Whenever an investor put some money in any Darwin, Darwinex – the asset manager who sells you the Darwin asset – manages the Risk according to its own algorithm independently of the Risk taken by the trader. In the case of EPG; by myself.
I don’t want to enter in technicalities, but they use what they call VaR (=Value at Risk) fixed to 95%. That means that “you might expect to lose 6.5% or more one month out of 20 months, or 5% of the time.”
It doesn’t matter if you understood the paragraph above or not. Truth is that it is pure statistics and applying this formula, any Darwin investor gets some important benefits:
- Security against trader craziness. If the trader who sells the signal wipe out its own account, the Darwin remains afloat
- Compliance law regulations. Law protects the investor
- Standardization: This means that all Darwins are comparable to each other regardless of the trader’s Risk Management. The trader behind can be more or less aggressive, use more or less leverage. It doesn’t matter, all the Darwins will use the same Risk Management policy so they can compare to each other
- It’s the average VaR of the SP500 index, So, in this sense Darwins are comparable to the most known index we can imagine

Still here?
Now, let’s see this wonder with our beloved Darwin EPG. In the next image I’m showing you the underlying strategy under EPG which is named “ratpenat”

We see that EPG and ratpenat don’t behave the same. How is that? Because of the Darwinex Risk Management engine. And Where is the difference? Ratpenat is much more abrupt than EPG. This means that when ratpenat grows, grows bigger. i.e.: Its ATH was at 91% while the EPG ATH was at 51%.
But oh boy! When it pulls back, pain is much much harder. EPG soften ratpenat’s curve, that is protects the investor.
This pattern is common in most of the Darwins over there, I don’t consider myself an aggressive trader. So, you would see these differences much more heavies in other Darwins.
Back to the Drawdown
As you see on the graph ratpenat’s max. drawdown is 21,62% which is more than double than 9,95% in EPG. And yes, Max drawdown in ratpenat is right now.
How much will it cost recover our ATH?
Well, the only thing we know as a fact, again, are the numbers. The table below is saying how much % will have to grow back to reach a new ATH.
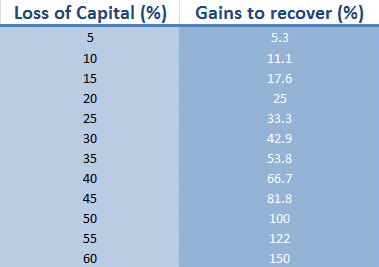
A moderate drawdown in any Darwin let’s say 20 – 25%, demands a symmetrical effort up and down. More than that would put us in a too much challenging situation. And that would be a clear red flag.

Hey. Enjoyed reading your blog and nice snapping out of that drawdown this month. Have gone through a lot of the same stuff you described. I trade indices, not fx really, and been trying to find something that works for UK or Australia but no luck, similar to your AUD attempts. I have better luck with Dax, the big US indices and Japan though. Anyway, hope to give you a fight for first in Darwinia next month with XTO.
Hi Noxire. I must say you have a very nice Darwin. Congrats for your performance and for your current DarwinIA allocation.
I have always been tempted to trade indexes because they have been clearly trending upwards so far. But I’m concerned about the quality of the data on CFD, that’s the main reason I never left FX.
Pingback: September 2022 - Professional Trading