In this post I’m going to give my personal view of Risk Management applied to trading which, I already tell you in advance:
To me, this is the most important part for any trading strategy.
As always, first is first, we should define what is ‘Risk Management’. In particular, what is Risk Management in our business. Definitions are important. Specially in the post-truth world!
- Risk is the amount of money you put on the table in a trade.
- Risk Management is how you calculate your Risk. Kind of, how do you manage your Position Sizing.
Really simple, isn’t it? However, your Risk leads you to consider concepts such as:
- Position Sizing. How many lots?
- Stop Loss. If the trade doesn’t go as expected, when do we take the loss? Meaning that, how much could we lose in a trade
There are other concepts involved with Risk Management as: StopLoss – where putting your StopLoss in case you’d use any StopLoss at all? – % Winning Ratio, Return Drawdown ratio, Take Profit, Trailing Stop,… All of them important and all of them key pieces to our Risk Management policy. They should be well known to explore the best Risk Management policy for our strategy.
Van Tharp. The Guru

One of the gurus on this matter was Van Tharpe. If you are really interested, you can look for some of his books. Nonetheless, I must warn you that despite Van Tharp gives unvaluable value on his books he is mostly a selling machine; never gives you the full picture and supposedly you will find the final answer in another of his books or in a course of him or even worst you should purchase him several of them. So, better continue with this post!
Wonderfully, Van Tharp calls Risk (definition on top of this article) as R. Also, he measured the result of each trade based on its R, which I think it’s quite interesting because it shows how much you win or lose according to the risk. This is what tells us the Risk/Reward ratio, by the way.
Since we are, you must know quite a few things regarding the Risk of your strategy. For instance:
- The average you win, it could be measured in R’s, in the strategy: That is defined as Expectancy.
- The volatility of your trades, again could be measured in R’s. Something I’ve seen as ‘variability’. Most comon way to measure it is by its standard deviation.
Maybe not clear enough about the two points above? It’s easy to understand but just in case let’s put a simple example:
Suppose you have three trades in your strategy. Let’s imagine we always risk 100€ in all our trades. And let’s say the results for each trade are +150, 0, -100. Some statistics we would get from this example:
- R = 100 for each trade. We measure R trade by trade, In this example R is equal in all the trades
- NetProfit = 50. That’s the result of +1.5R, 0R, -1R
- Expectancy = 17, or 0.17R
Coming back to Van Tharpe he gets to combine it all together in a single ratio called SQN which I find it extremely useful. Yes, I use SQN on my own strategies!
By the way, have you ever heard about the SQN table? Van Tharp was so ecstatic with his SQN that gave us the next table to evaluate a strategy:

Well, I would take that table with a piece of salt. But it takes no effort to check our strategies and watch them through the SQN scanner.

What? Expectancy, SQN, standard deviation,… Tired of so much math and formulas? In this case, maybe you should think on the next game.
Exercice
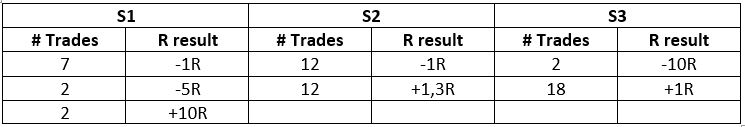
If I gave you to choose one and only one of these 3 strategies. Which one would you choose? Betting 1,000 per trade:
- S1: It wins 20% of its trades, trades 25 per month
- S2: It wins 50% of its trades, trades 75 per month
- S3: It wins 90% of its trades, trades 60 per month
The percentage of winnings vs losers in your strategy is called Win Rate ratio or Win/Loss ratio, it’s the same.
Yes, yes. I know. You should ask yourself how much wins each Strategy? Meaning, the ‘Net Profit’. Let’s say last week S1 lost 1,000, S2 won 1,000 and S3 won 2,000. So far S3 looks quite good, isn’t it?
How about we extend the backtest to 1 month instead of 1 week and see the results?
Not so obvious now which strategy to choose. Although S3 doesn’t look so good now. After some simple calculations:
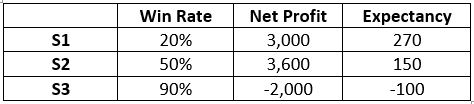
You could complete the table above with additional ratios as SQN; which will add the standard deviation of your R’s (the variability, remember?), Profit Factor, Sharpe, Calmar,… According the Ratio you choose you will be jumping between S1 and S2.
First conclusions so far are:
Conclusion 1
Backtests are important to really know your strategy. Not the same one week that one month to make decisions. What if we made one year instead of one month? So, it raises a new question here: How long should be our Backtest?
Aha! That goes beyond the Risk Management and maybe I should write another Post about it. Now, let’s move on!
Conclusion 2
Expectancy is our genius coming from the math world that whispers to our ears if the strategy has an edge or not.

As said, you can replace the Expectancy for another more sophisticated genius. I wouldn’t recommend much more sophistication, though.
Ok, now we are ready to choose. I would take S1, wouldn’t you?
Who was going to say! Choosing something with just 20% Win/Loss ratio when we could choose 90%, and just 3,000 profit per month when we could have 3,600. That’s giving up 20% profit per month.
Risk Management is all
Well, I know S1 is not the holy grail, but it has an edge, hasn’t it? I have found my way to the richness.
Can I call tomorrow to my boss and talk about one thing or two?… Not too fast, my friend.
Now that we have a strategy with a real edge in our pocket, the hard work begins.
Yes, how much to bet on the next trade… The Risk Management, my friend.
It shouldn’t be that difficult! We have tons of math to calculate things and computers to give us numbers.
Before going to dig into the math. Let me emphasize how important is the Risk Management. Imagine that in S1 you would bet 1,100 per trade. That is your ruin guaranteed, betting 1,000 you would suffer 90% Drawdown which is unbearable for any human being. Again, how much to bet on the next trade. There are a lot of experiments, similar games giving the same strategy with real edge to several people. Percentage of ruin between all the participants is shockingly high.
Maybe the most famous real experience is that of the Turtles. It is well known and famous, so I won’t go into details, at least on this post. The thing is: Some big traders published in newspapers they wanted people to trade. The applicants shouldn’t have any experience in trading, they would receive all the training and the rules to follow to trade. The rules were bulletproof. Can’t lose!
Result: After one year, aprox., some were broken, some others break even, some won pennies. Only a minority won real money. Where was the difference? Risk Management.
To be continued…