About the Divergence in Darwinex.
Motivation for this post
I must acknowledge the contribution of an attentive reader of this blog who contacted me a couple of weeks ago asking about the reasons for EPG’s low Divergence values.
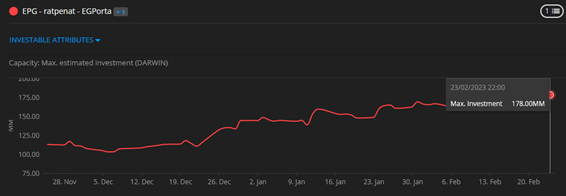
How is that possible, I thought? I was convinced that one of the strengths of EPG was its Divergence, as I stated in the last post of 2022 summing up my results. After all, EPG’s capacity is very powerful: Over €150M in potential investment.
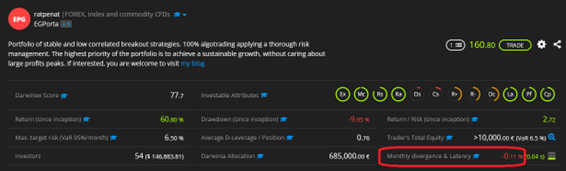
But indeed, the current values of the monthly EPG Divergence today as I’m writing this post are negative:
How can that be understood?
Before we go any further, let’s look at what ‘Divergence’ means in Darwinex.
Divergence. Definition
The best definition of the Darwinex Divergence concept will be given by Darwinex itself. Here is a link with a full and detailed explanation. It is recommended reading to really understand it:
If I may put it in my own words, the Divergence is the measure offered by Darwinex to measure the Slippage on a position between the trader’s Order and the investor’s Order.
In other words: When a trader launches an order in his strategy, it will be replicated (passing the filters of his Risk engine, etc.) in the investor’s account. Between the trader’s account order and the investor’s account order there is a difference of milliseconds and consequently, the trades of the investor and the invested Darwin will never be identical. The investor’s always reacts a few milliseconds behind.
The Divergence is thus a reading of how different the equities are between Darwin and Investor. In positive Divergences, the investor is favoured by this difference. In negative Divergences, the investor is disadvantaged.
Some Darwins, by nature, will have high Divergences. For example; a Scalping strategy is sure to have high Divergences as the accuracy of entries and exits is critical to this type of strategy.
Also, in Darwins that move large volumes of investment, they will have a higher Divergence. This is because the broker (Darwinex) has to bring to market the Darwin order that is being replicated. Large volumes of money to market will have a higher Slippage and consequently affect the Divergence of the Darwin. In the latter case, it is not how the Darwin is trading but the inevitable Slippage of moving large volumes of money to the market.
There are other factors that also influence Divergence, but I’ll leave those for you to read in the Darwinex article as so much technicality is starting to get very boring.
Does Divergence really matter that much?
Yes, of course. High Divergence values can mean differences of up to 5% between a Darwin’s Equity and that of his investors.
Divergence should therefore be a consideration for any investor.
What Divergence can we expect in EPG?
Well, in theory EPG should have a favourable Divergence for the Investor, or at least not much impact:
1- It is not a Scalping strategy. The average duration of its trades is slightly more than 1 day.
2- EPG entries are 100% breakout. It is not very precise in the entries. A few milliseconds difference should matter little. As for the exits, we are not snipers at the exit point either.
3- Finally, EPG is very undercapitalised. In other words, its capacity is far greater than the investment it is currently managing.
So, tell me, what is the EPG Divergence?
Well here, my dear friends, the answer is that it depends on when you look at it.
To be more specific: The Divergence value of a Darwin depends on when you look at it. It looks like Quantum Physics! Actually, it’s not that complicated.
This is where both the reader who contributed his comment in a personal email and myself are wrong.
At the end of December 2022, I posted my blog taking stock of the year in EPG with a Divergence value of +0.23. This was an additional 5% return for the Investor as seen in the graph:

Whereas today, the EPG Divergence is -0.11 and now the graph looks completely different:
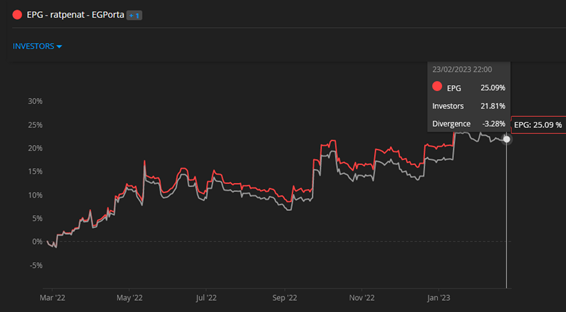
The investor has lost 3% of profitability….. In theory.
That is to say. When I looked and posted at the end of the year the investor was earning an extra 5% and in today’s post the investor loses 3%?
Solving the Mistery
The answer to the contradiction between the graph with the Investor curve gaining 5% last month and the graph with the same curve showing -3% for the Investor is that both graphs are not ‘real’.
Darwinex calculates the Divergence based on the last 100 trades. Consequently, the Divergence will vary over time. So far, this is understandable.
What misleads us is that Darwinex takes the current value of the Divergence and repaints the Investor’s curve with that value: As if the Divergence had always had the current value, which is not true!
So neither of the two investor curve graphs are adequate to draw any conclusions. They mislead!
However, there is a very interesting graph that we should look at. Activating the tick to visualize the Divergence curve will show us the evolution of Divergence over time:
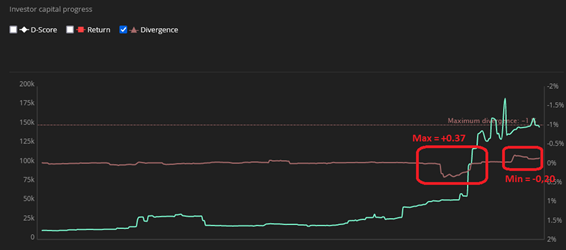
We are only interested in the brown line and not the green one. The brown line shows the evolution of the Divergence value over time. In the case of EPG, we have had a maximum value of 0.37 and a minimum of 0.20
Probably the best way to analyze this subject of the Divergence in any Darwin is by looking at the average value of its Divergence with the graph above.
I think we can say now: Mistery solved!